Royals Infographic
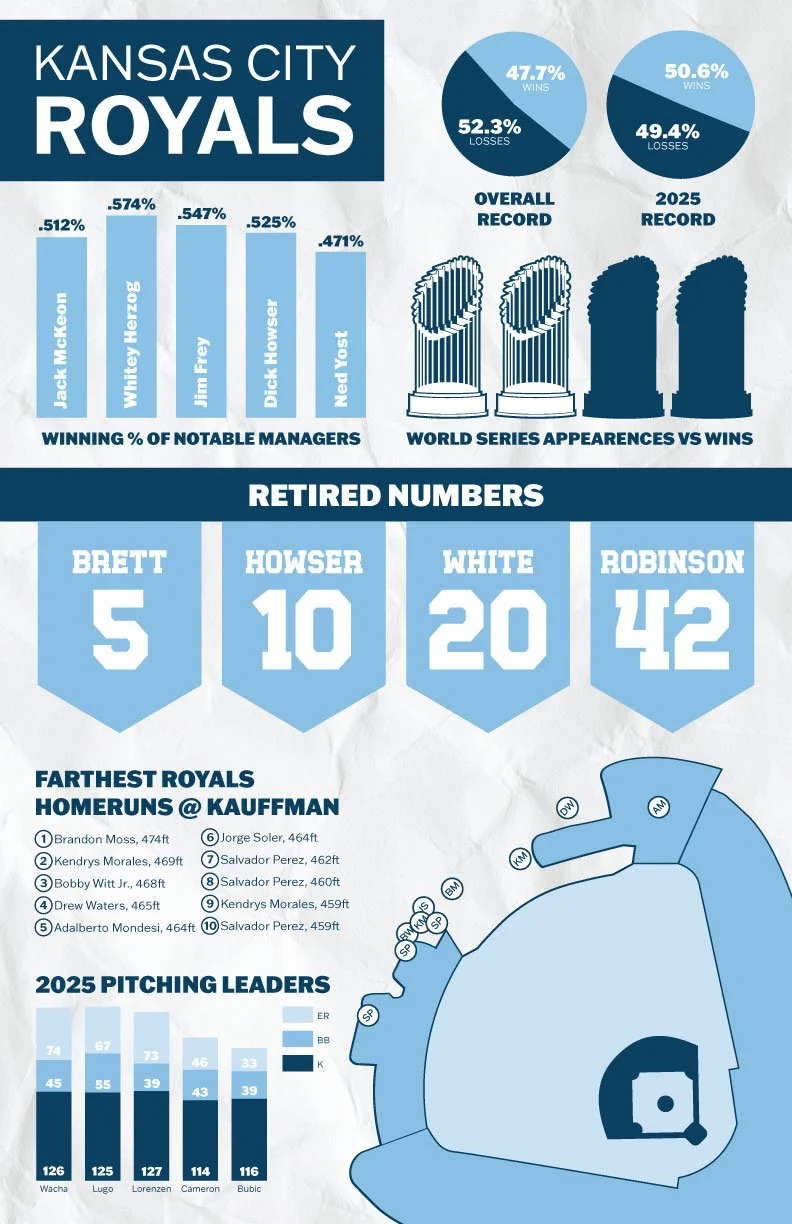
For this project, I created an infographic on the Kansas City Royals (my favorite baseball team), combining data visualization with original illustration. Every illustration was created by me—including the World Series trophy and the ballpark—and the charts were built in Adobe using real statistics to guide the layout and storytelling.
The main goal was to take a large amount of information and make it feel clear, engaging, and visually cohesive, while still being easy to read at a glance. This project really pushed me to think about hierarchy, spacing, and how thoughtful design choices can help tell a story through data rather than just display numbers.
I had so much fun working on this piece. Getting to research a team I’m already passionate about made the process even more exciting, and I enjoyed the challenge of designing something that aligned with the Royals’ brand guidelines while still showcasing my own illustration style.